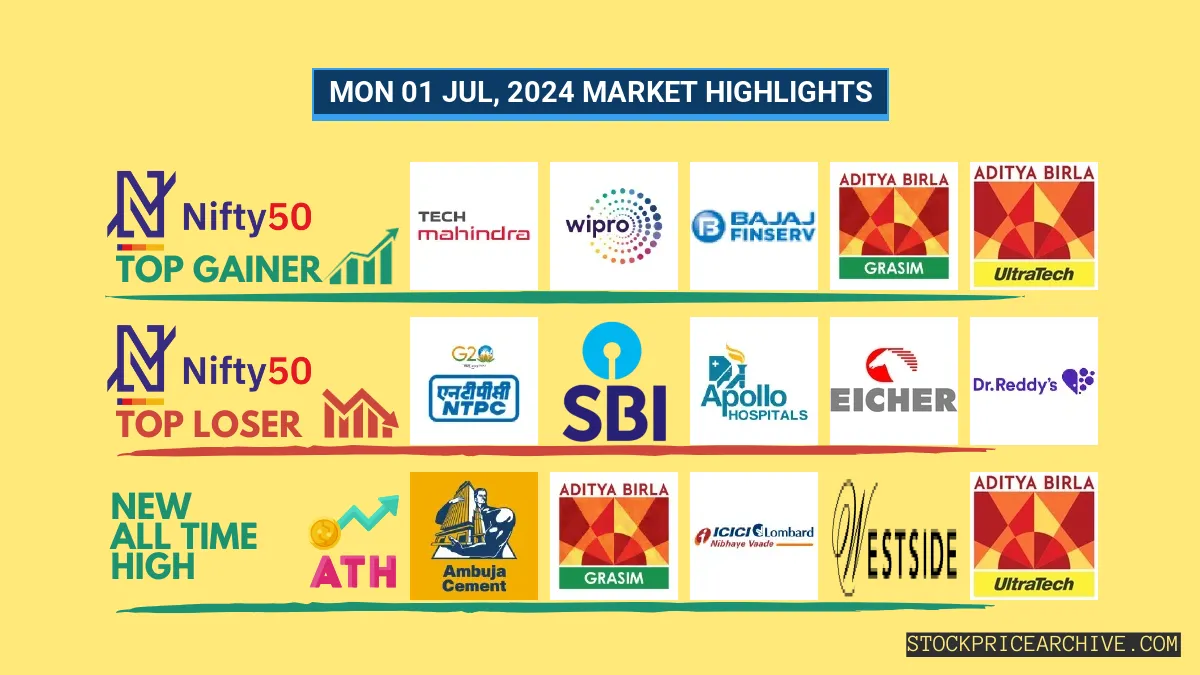
01 Jul 2024: Nifty Closes at ₹24,123.15 (+0.46%)

Show Table of Contents
Top Indices Performance Overview
Nifty 50 Performance Overview
The Nifty 50 started the day at ₹24,022.59, showing some spirited movement throughout the session. It dipped to a low of ₹24,007.05 before reaching a peak of ₹24,162.9. By the closing bell, it settled at ₹24,123.15 (+0.46%), ending the day on a positive note.
Nifty 50 Top Gainers
Nifty 50 Top Losers
Nifty 50 Stocks To Watch for Tomorrow
GRASIM (Bullish Pattern)
- Performance Overview: In the last 25 trading sessions, GRASIM has closed in the green 16 times and in the red 9 times.
- Recent Trend: GRASIM has been on a 6-day green streak, with no red days since Friday, June 21, 2024.
- Returns: GRASIM has delivered a strong 11.63% return over the past 25 trading sessions. This means that an investment of ₹10,000 would have grown to ₹11,163.
- Financial Insight: Over the past 12 months, GRASIM has generated a revenue of ₹1,30,978.48 Crore and a profit of ₹5,624.48 Crore.
- As of Monday, July 1, 2024, GRASIM has a Market Capital of ₹1,81,171.06 Crore.
- Summary: GRASIM is showing a strong bullish pattern, making it an exciting stock to watch. Investors might want to consider its potential for both short-term and long-term growth. Checkout GRASIM Target for Tomorrow and GRASIM Targets for 2024 & 2025 for further insights.
GRASIM Financial Performance
➲ Eicher Motors (Bearish Trend)
- Recent Performance: Over the last 25 trading days, Eicher Motors has closed lower than the previous day 17 times, and higher 8 times.
- Current Trend: Eicher Motors has been on a downward trend for the past five trading days, with no gains since Monday, June 24, 2024.
- Returns: Eicher Motors has seen a -4.64% decrease in value over the past 25 trading sessions. This means an initial investment of ₹10,000 would be worth ₹9,536 today.
- Financial Highlights: In the last year, Eicher Motors generated revenue of ₹16,535.77 Crore and a profit of ₹4,001.01 Crore.
- As of Monday, July 1, 2024, Eicher Motors has a Market Capital of ₹1,28,043.97 Crore.
- In Summary: Eicher Motors is currently showing a bearish trend. We recommend investors keep a close eye on the stock’s movement, particularly considering the Eicher Motors Target for Tomorrow and Eicher Motors Targets for 2024 & 2025.
Eicher Motors Financial Performance
Nifty 500 Performance Overview
The Nifty 500 started the day at ₹22,580.05 and saw some exciting swings throughout the session. It dipped to a low of ₹22,571.09 before rallying to a high of ₹22,739.59. The index closed the day strong, finishing at ₹22,719.8 (+0.7%).
This movement was likely influenced by the top gainers and losers, which are listed in the table below.
Nifty 500 Top Gainers
Nifty 500 Top Losers
Nifty 51 to 500 Stocks To Watch for Tomorrow
Indus Towers (Showing Positive Signs)
- Recent Performance: Over the past 25 trading days, Indus Towers has closed higher on 17 occasions and lower on 8. This indicates a strong upward trend.
- Current Trend: Indus Towers has been on a roll, closing higher for the past 8 days straight! This positive momentum began on Wednesday, June 19, 2024.
- Returns: In the last 25 trading sessions, Indus Towers has delivered impressive returns of 12.24%. This means that an initial investment of ₹10,000 would have grown to ₹11,224.
- Financial Highlights: During the last 12 months, Indus Towers generated a substantial revenue of ₹28,600.59 Crore and achieved a profit of ₹6,036.19 Crore. This strong performance signals financial health and potential for growth.
- As of Monday, July 1, 2024, Indus Towers has a Market Capitalization of ₹1,01,104.68 Crore, demonstrating its significant market presence.
- In Summary: Indus Towers exhibits a promising upward trend, making it a potential opportunity for investors seeking growth. It’s important to keep an eye on its price movements to gauge both short-term and long-term potential. Check out Indus Towers Target for Tomorrow and Indus Towers Targets for 2024 & 2025 for further insights.
Indus Towers Financial Performance
➲ Hindustan Petroleum (Bearish Pattern)
- Performance Overview: In the last 25 trading sessions, Hindustan Petroleum has closed lower than the previous day 14 times and higher 11 times.
- Recent Trend: Hindustan Petroleum has been on a 7-day downward trend, without a single day closing higher since Thursday, June 20, 2024.
- Returns: Hindustan Petroleum has seen a -38.99% return in the last 25 trading sessions, meaning a ₹10,000 investment would have become ₹6,101.
- Financial Insight: Over the past 12 months, Indus Towers has generated a revenue of ₹4,32,034.7 Crore and a profit of ₹16,014.6 Crore.
- As of Monday, July 1, 2024, Indus Towers has a Market Capital of ₹70,664.9 Crore.
- Summary: Hindustan Petroleum is currently facing some challenges, showing a bearish trend. It’s wise to keep a close eye on its performance, especially checking the Hindustan Petroleum Target for Tomorrow and Hindustan Petroleum Targets for 2024 & 2025.
Hindustan Petroleum Financial Performance
Top Stocks That Created a New All Time High Today
Top Large Cap Stocks That Created a New All Time High Today
Companies with Market Capital more than 20,000 Crores
Top Mid Cap Stocks That Created a New All Time High Today
Companies with Market Capital between 5,000 Crores to 20,000 Crores
Top Small Cap Stocks That Created a New All Time High Today
Companies with Market Capital less than 5,000 Crores


