Nifty 50 Closes at ₹24,434.19 (-0.19%) with Apollo Hospitals and Adani Enterprises Showing Contrasting Trends

Show Table of Contents
Top Indices Performance Overview
Nifty 50 Performance Overview
The Nifty 50 kicked off the day at ₹24,445.05. Throughout the trading session, it saw some ups and downs, dipping to a low of ₹24,307.25 and reaching a high of ₹24,504.25. By the closing bell, it settled at ₹24,434.19, representing a slight dip of -0.19% for the day.
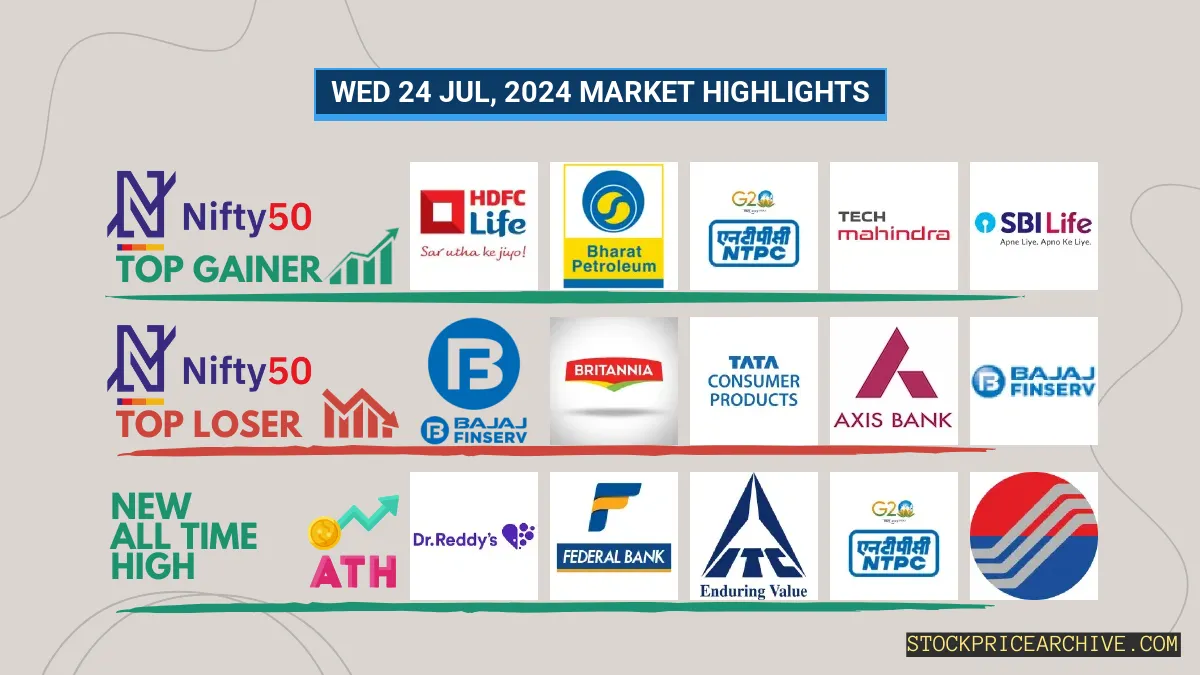
The movement of the Nifty 50 today was influenced by top gainers and losers, which we’ll explore in more detail below.
Nifty 50 Top Gainers
Nifty 50 Top Losers
Nifty 50 Stocks To Watch for Tomorrow
Apollo Hospitals (Bullish Pattern)
- Performance Overview: In the last 26 trading sessions, Apollo Hospitals has closed higher than the previous day 17 times and lower 9 times.
- Recent Trend: Apollo Hospitals has been on a 3-day winning streak, without a single day closing lower since Fri 19 Jul 2024.
- Returns: Apollo Hospitals delivered a 3.17% return in the last 26 trading sessions, meaning an investment of ₹10,000 would have grown to ₹10,317.
- Financial Insight: Over the past 12 months, Apollo Hospitals has generated a revenue of ₹19,059.19 Crore and earned a profit of ₹898.6 Crore.
- As of Wed 24 Jul 2024, Apollo Hospitals has a Market Capital of ₹91,762.86 Crore.
- Summary: Apollo Hospitals is showing a strong bullish pattern. Keep an eye on its price movements as it holds potential for both short-term and long-term growth. Check out Apollo Hospitals Target for Tomorrow and Apollo Hospitals Targets for 2024 & 2025.
Apollo Hospitals Financial Performance
➲ Adani Enterprises (Bearish Pattern)
- Performance Overview: Over the past 26 trading days, Adani Enterprises has closed lower 17 times and higher 9 times. This suggests a bearish trend, with more red days than green.
- Recent Trend: Adani Enterprises is currently on a 5-day losing streak, not closing higher since Tuesday, July 16th, 2024.
- Returns: In the last 26 trading sessions, Adani Enterprises has experienced a -10.26% return. This means an investment of ₹10,000 would have decreased to ₹8,974.
- Financial Insight: Over the past 12 months, Apollo Hospitals has generated a revenue of ₹96,420.98 Crore and recorded a profit of ₹3,104.19 Crore.
- As of Wednesday, July 24th, 2024, Apollo Hospitals has a Market Capital of ₹3,42,649.78 Crore.
- Summary: Adani Enterprises is currently in a bearish phase. We recommend investors keep a close eye on the stock, particularly looking at the Adani Enterprises Target for Tomorrow and Adani Enterprises Targets for 2024 & 2025.
Adani Enterprises Financial Performance
Nifty 500 Performance Overview
The Nifty 500 kicked off the day at ₹22,855.84. Throughout the trading session, it experienced some ups and downs, hitting a low of ₹22,820.3 and reaching a high of ₹22,964.94 before finally settling at a close of ₹22,941.05 (+0.33%).
The top gainers and losers played a role in shaping the Nifty 500’s movement today.
Nifty 500 Top Gainers
Nifty 500 Top Losers
Nifty 51 to 500 Stocks To Watch for Tomorrow
Ajanta Pharma: Looking Bullish (✉️)
- Performance Overview: Over the last 26 trading days (since July 1st), Ajanta Pharma has closed higher on 14 days and lower on 12 days.
- Recent Trend: Ajanta Pharma has been on a roll, closing higher for the past 5 trading days! The stock hasn’t dipped since July 16th.
- Returns: If you invested ₹10,000 in Ajanta Pharma on July 1st, it would have grown to ₹10,061 as of July 24th, representing a 0.61% return.
- Financial Insight: In the past 12 months, Ajanta Pharma generated impressive revenue of ₹4,208.71 Crore and a profit of ₹816.16 Crore.
- Market Size: As of July 24th, 2024, Ajanta Pharma has a market capitalization of ₹28,569.38 Crore.
- Summary: Ajanta Pharma is exhibiting a strong bullish pattern, making it an interesting stock to watch. Whether you’re looking for short-term gains or long-term growth, consider exploring the potential of Ajanta Pharma: Checkout Ajanta Pharma Target for Tomorrow and Ajanta Pharma Targets for 2024 & 2025.
Ajanta Pharma Financial Performance
➲ Rainbow Childrens Medicare (Bearish Trend)
- Performance Snapshot: Over the last 26 trading days, Rainbow Childrens Medicare has closed lower than the previous day 17 times, and higher 9 times.
- Recent Trend: Rainbow Childrens Medicare has been on a 9-day downward streak, with no gains since Wednesday, July 10, 2024.
- Returns: Rainbow Childrens Medicare has experienced a -17.02% return over the past 26 trading days. This means that a ₹10,000 investment in the stock would have shrunk to ₹8,298.
- Financial Snapshot: Looking back at the past 12 months, Rainbow Childrens Medicare generated a revenue of ₹1,272.76 Crore and a profit of ₹219.62 Crore.
- As of Wednesday, July 24, 2024, Rainbow Childrens Medicare has a Market Capitalization of ₹12,637.5 Crore.
- Summary: Rainbow Childrens Medicare is currently experiencing a bearish period. We suggest keeping a close watch on the stock’s performance, especially Rainbow Childrens Medicare Target for Tomorrow and Rainbow Childrens Medicare Targets for 2024 & 2025.
Rainbow Childrens Medicare Financial Performance
Top Stocks That Created a New All Time High Today
Top Large Cap Stocks That Created a New All Time High Today
Companies with Market Capital more than 20,000 Crores
Top Mid Cap Stocks That Created a New All Time High Today
Companies with Market Capital between 5,000 Crores to 20,000 Crores
Top Small Cap Stocks That Created a New All Time High Today
Companies with Market Capital less than 5,000 Crores


