20% Upper Circuit In This ₹6 Share; Huge Demand In This Penny Stock; Share Will Double?

Penny Stock Return: After several days of pressure, the stock market rose once again on Thursday. In this positive environment, there was a huge demand for many penny stocks.
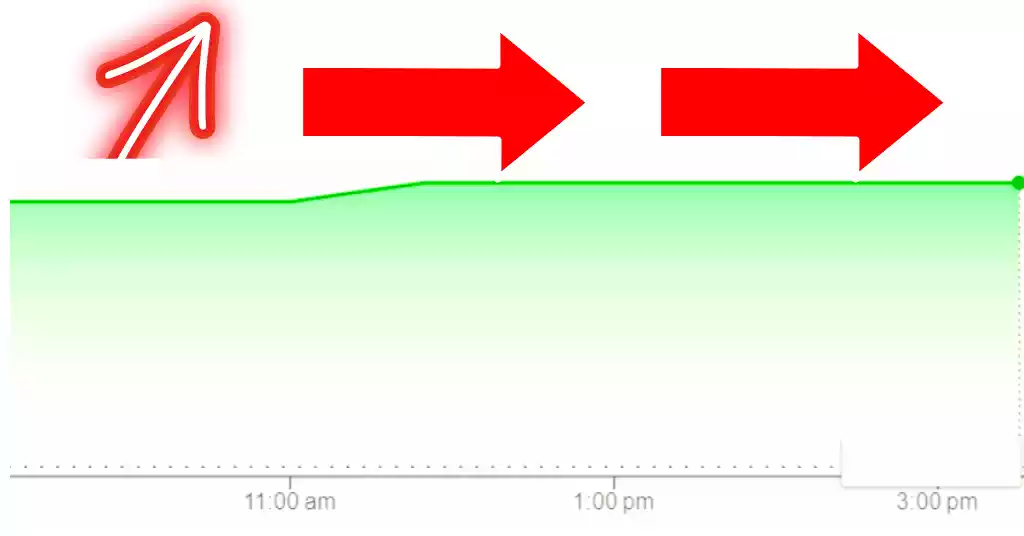
One of these penny stocks is Kenvi Jewels Ltd stock. The stock hit a high of 20% upper circuit on the fourth trading day, Thursday during the trading.
During trading the share price reached the level of Rs 7.22. At the same time, the share closed at Rs 6.95.
This price represents a positive return of 15.45% from the previous closing of Rs 6.02. Let us tell you that in June 2023, this share had touched 52 52-week highs of Rs 15.70.
What Is The Shareholding Pattern
If we look at the shareholding pattern of Kenvi Jewels Limited, 64.72 percent stake is with the promoters. The public shareholding in the company is 35.28 percent.
The company’s promoters include Navikkumar Champaklal Valani, Champaklal Devchandbhai Valani, Chirag Champaklal Valani, and Hetal Chirag Valani.
How Was The December Quarter Results?
Kenvi Jewels Ltd’s sales grew 64.15% to Rs 36.16 crore during the December quarter. Sales in December 2022 were Rs 22.03 crore.
The net profit of the company was Rs 0.25 crores in the quarter ending December 2023.
It was Rs 0.08 crore in the December 2022 quarter. This is a significant increase of 218.71%.
Condition Of The Stock Market
On Thursday, BSE’s 30-share sensitive index Sensex jumped by 539.50 points to 72,641.19 points.
With this, the Nifty of the National Stock Exchange (NSE) jumped 172.85 points and closed at 22,011.95 points.
BSE Midcap gained 2.36 percent to 38,652.42 points and Smallcap gained 2.01 percent to 42,321.99 points.
About Kenvi Jewels Ltd
Kenvi Jewels Limited, a company based in India, is engaged primarily in manufacturing and selling jewelry.
Manek Chowk is the company’s manufacturing facility. The jewelry is designed in-house.
The Company can also have its jewelry designed and manufactured by third-party designers when required.
The company sells gold jewelry with or without diamonds and precious stones. The product range of the Company includes wedding jewelry and festive jewelry.
It also features rings, chains, earrings, ear-chains, nose-rings/nosepins, waistbelts/mangal sutras, anklets/zudas, toe rings/toe rings, pendants/pendants/pendant sets, bracelets, and bangles.
The company’s portfolio includes a wide range of jewelry, including traditional, Indo-Western, and modern. The company also custom-makes jewelry to meet individual requirements.
Suvarnakrupa is the company’s brand name for its jewelry.
Fundamental Analysis of Kenvi Jewels Ltd
| Market Cap | ₹ 87.8 Cr. |
| Current Price | ₹ 6.95 |
| 52-wk High | ₹ 15.7 |
| 52-wk Low | ₹ 4.76 |
| Stock P/E | 107 |
| Book Value | ₹ 1.11 |
| Dividend | 0.00 % |
| ROCE | 7.29 % |
| ROE | 4.03 % |
| Face Value | ₹ 1.00 |
| P/B Value | 6.24 |
| OPM | 1.32 % |
| EPS | ₹ 0.06 |
| Debt | ₹ 4.84 Cr. |
| Debt to Equity | 0.34 |
Kenvi Jewels Ltd Share Price Target 2024 To 2030
| Year | 1st Target | 2nd Target |
| 2024 | ₹7 | ₹10 |
| 2025 | ₹11 | ₹16 |
| 2026 | ₹18 | ₹20 |
| 2027 | ₹22 | ₹31 |
| 2028 | ₹32 | ₹42 |
| 2029 | ₹45 | ₹60 |
| 2030 | ₹62 | ₹85 |
Kenvi Jewels Ltd Shareholding Pattern
| Promoters Holding | |
| Dec 2022 | 65.10% |
| Mar 2023 | 65.10% |
| June 2023 | 65.10% |
| Sept 2023 | 65.10% |
| Dec 2023 | 64.72% |
| Public Holding | |
| Dec 2022 | 34.89% |
| Mar 2023 | 34.89% |
| June 2023 | 34.89% |
| Sept 2023 | 34.90% |
| Dec 2023 | 35.28% |
Kenvi Jewels Ltd Share: Last 5 Years’ Financial Condition
To gain a better understanding of how the market is performing, let’s look at the outlook of this share in the previous years.
However, investors should be aware of the risks and the market conditions before making any investment decision.
Last 5 Years’ Sales:
| 2019 | ₹31 Cr |
| 2020 | ₹35 Cr |
| 2021 | ₹40 Cr |
| 2022 | ₹67 Cr |
| 2023 | ₹118 Cr |
Last 5 Years’ Net Profit:
| 2019 | ₹0 Cr |
| 2020 | ₹0 Cr |
| 2021 | ₹0 Cr |
| 2022 | ₹0 Cr |
| 2023 | ₹1 Cr |
Last 5 Years’ Debt-To-Equity Ratio:
| 2019 | 0.13 |
| 2020 | 0.05 |
| 2021 | 0.09 |
| 2022 | 0.03 |
| 2023 | 0.07 |
Last 10 Years’ Profit Growth:
| 10 Years: | — |
| 5 Years: | 43% |
| 3 Years: | 33% |
| Current Year: | 19% |
Last 10 years’ Return on Equity (ROE):
| 10 Years: | — |
| 5 Years: | 2% |
| 3 Years: | 3% |
| Last Year: | 4% |
Sales Growth Over 10 Years:
| 10 Years: | — |
| 5 Years: | 38% |
| 3 Years: | 37% |
| Current Year: | -16% |
Conclusion
This article is a complete guide about Kenvi Jewels Ltd Share.
These information and forecasts are based on our analysis, research, company fundamentals and history, experiences, and various technical analyses.
Also, We have talked in detail about the share’s future prospects and growth potential.
Hopefully, these informations will help you in your further investment.
If you are new to our website and want to get all the latest updates related to the stock market, join us on Telegram Group.
If you have any further queries, please comment below. We will be happy to answer all your questions.
If you like this information, share the article with as many people as possible.
Disclaimer: Dear readers, we’d like to inform you that we are not authorized by SEBI (Securities and Exchange Board of India). The information on this site is only for informational and educational purposes and shouldn’t be considered financial advice or stock recommendations. Also, the share price predictions are completely for reference purposes. The price predictions will only be valid when there are positive signs on the market. Any uncertainty about the company’s future or the current state of the market will not be considered in this study. We are not responsible for any financial loss you might incur through the information on this site. We are here to provide timely updates about the stock market and financial products to help you make better investment choices. Do your own research before any investment.


